Third sound on copper and glass twin bars
Jan-Pascal van Best

Kamerlingh Onnes Laboratory
Leiden State University, August 1996
Contents
1 Third Sound
1.1 Introduction
1.2 Third sound speed
1.3 Third sound attenuation
1.4 Film thickness
1.4.1 The vapour pressure pv
1.4.2 The number of 4He atoms in the cell N
1.4.3 The third sound speed c3
2 Phonon modes in thin films recalculated
2.1 Introduction
2.2 A new phonon distribution function
2.2.1 Crystal dimensions
2.2.2 The density of states over w
2.2.3 Angular dependence of phonon density
2.2.4 The density of states over w recalculated as a check
2.2.5 Taking into account discreteness of ky
2.2.6 The density of states over q
2.3 Monte Carlo simulations
2.4 Kapitza resistance
2.4.1 Heat flux
2.4.2 Kapitza resistance
2.5 Discussion
2.5.1 Experimental support
2.5.2 Suggestions for improvement
3 Experimental set-up
3.1 Cryogenics
3.2 The cell
3.3 The bar geometry
3.4 Electrolytic polishing of copper
3.5 Excitation of third sound
3.6 Detection of third sound
3.7 Gas handling system
4 Experimental results
4.1 Third sound signals
4.2 Third sound speed
4.2.1 Comparison of c3,gl and c3,Cu
4.2.2 Calculation of dgl and dCu
4.2.3 c3,Cu versus dCu
4.3 Third sound attenuation
4.3.1 Calculation of the attenuation coefficient a
4.3.2 Attenuation on the glass bar
4.3.3 Attenuation on the copper bar
4.4 Discussion and conclusions
4.4.1 Third sound on copper
4.4.2 Comparison with Brisson's experiments
4.4.3 Attenuation coefficient on copper
4.4.4 Problem: Pressure determination
4.4.5 Problem: Film thickness determination error
A Drawings
B Symbols
List of Figures
1.1 Third sound speed c3 in 4He on glass as a function of film thickness d
1.2 Attenuation coefficient a on glass as a function of film thickness d
1.3 Attenuation coefficient a on copper as a function of film thickness d
2.1 Phonon \mathaccent "017E\relax k-vectors with \voidb@x w\mathaccent "017E\relax k < 5
2.2 Distribution function over w for w < 0.1 ·1015 \voidb@x \voidb@x s-1
2.3 Distribution function over w for w < 1012 \voidb@x \voidb@x s-1
2.4 Distribution function over w for w < 109 \voidb@x \voidb@x s-1
2.5 Distribution function over q for w < 1012 \voidb@x \voidb@x s-1
2.6 Kapitza resistance between gold heater and glass substrate as a function of T
3.1 Pumped 4He cryostat
3.2 Experimental cell
3.3 Twin bars setup
3.4 Setup for electropolishing the copper bar
3.5 Electrical circuit for electropolishing
3.6 Typical electropolishing I,V-diagram
3.7 Heater on copper
3.8 Excitation electronics
3.9 Tunnel diode and filtering electronics
3.10 Detection system
3.11 Gas handling system
4.1 Third sound signal on glass. \voidb@x n \voidb@x in = 16.83 mmol
4.2 Third sound signal on glass. \voidb@x n \voidb@x in = 35.9 mmol
4.3 Third sound signal on copper. \voidb@x n \voidb@x in = 35.9 mmol
4.4 Third sound speed c3 on copper and on glass as a function of the amount of 4He in the cell
4.5 Third sound speed c3,Cu on copper as a function of 4He film thickness dCu
4.6 Third sound attenuation a on glass as a function of 4He film thickness d
4.7 Third sound attenuation a on copper as a function of 4He film thickness \voidb@x dCu
4.8 Brisson's heater
A.1 Bottom plate in experimental cell
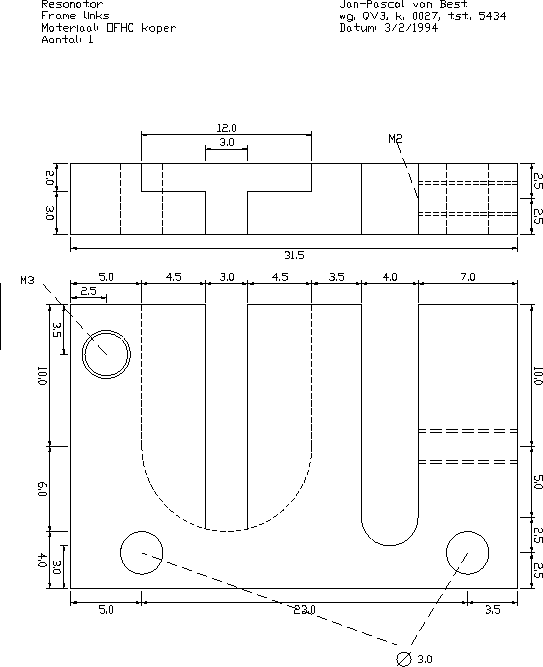
A.2 Left frame piece
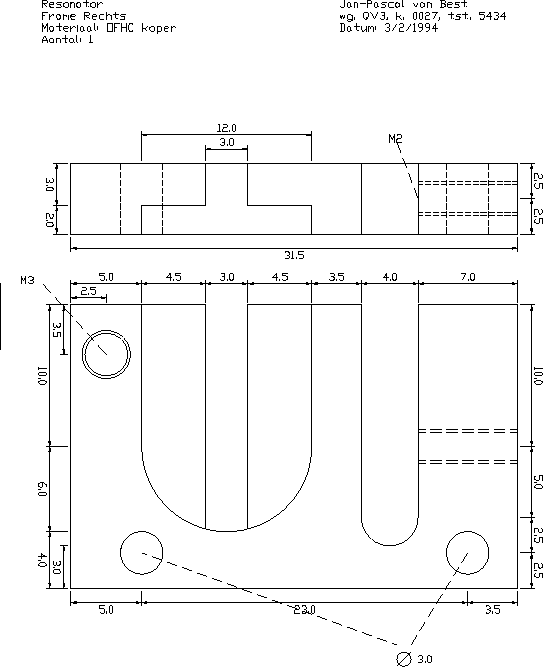
A.3 Right frame piece
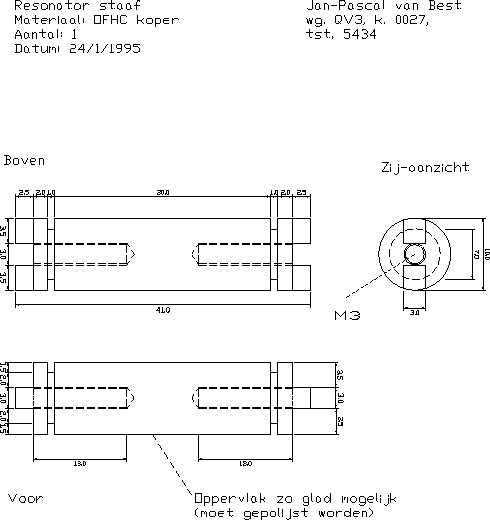
A.4 Copper resonator bar
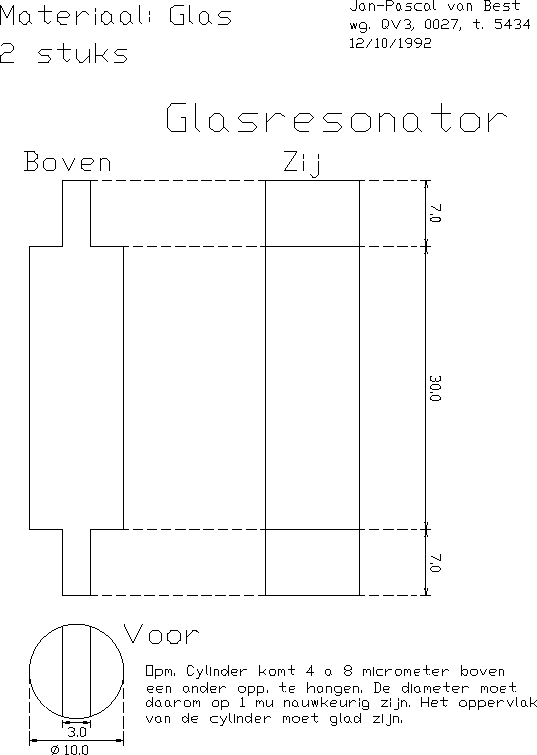
A.5 Glass resonator bar
A.6 Mounting platform
1.1 Introduction
Liquid 4He becomes a superfluid, i.e., it can flow without friction,
below the l-temperature (2.18 K).
Superfluid 4He can be described by the two-fluids model[1].
This model states that the liquid consists of two parts:
- A normal part that is viscous and carries entropy.
- A superfluid part that is not viscous and does not carry entropy.
In a superfluid 4He film, a surface wave called third sound
can be excited. Only the superfluid part takes part in the surface wave,
because the normal part is stuck to the wall
as long as the viscous penetration depth is smaller
than the film thickness.
Third sound consists of both temperature and film thickness
oscillations and can be excited by either a heat pulse or a strong electric
field.
Third sound has been studied extensively,
mostly on a glass
substrate[7].
Subjects of study have been the propagation speed and the
damping coefficient, as a function of film thickness and temperature.
To extend these experiments to 3He, the film has to be cooled below 0.93 mK,
the 3He superfluid transition temperature. Because it is hard to cool
glass to these temperatures, a copper substrate has to be used.
Experiments with third sound on a copper substrate, using 4He,
have been described previously [14].
In these experiments a copper cylinder was
used which enabled resonant measuments; in previous experiments of the
same group a flat glass surface was used so that only time-of-flight
measurements could be performed.
The present work was undertaken to link previous experiments with
a copper cylinder to those with glass. For this, an
experimental cell that contains both a glass and
a copper cylinder was built in order to measure properties,
especially third sound speed and attenuation,
of third sound
on both substrates under the same circumstances.
The experiments described in this report involve the use of a thin gold
heater to excite
the third sound. Theoretical work on phonon modes and Kapitza
resistances at low temperatures and with thin materials was
performed as well (Chapter 2).
All symbols used in this paper are given in Appendix B.
1.2 Third sound speed
From the film equations of the two-fluids model the following
equation for the third sound speed can be derived[1]:
|
c32 = |
æ
ç
è
|
|
rs
r
|
ö
÷
ø
|
f
|
f(d) d |
| (1.1) |
with
Where
|
| |
|
|
|
Third sound speed (m s-1) |
| |
|
|
Non-superfluid layer (see below) |
| |
|
| |
|
|
Superfluid fraction in bulk 4He |
| |
|
|
Average superfluid fraction of the film |
| |
|
|
Van der Waals attractive force ( m s-2 ) |
| |
|
| |
|
|
Van der Waals potential (m2 s-2) |
| |
|
|
Van der Waals constant (g = 2.6·10-24 m5s-2 for glass) |
| |
|
| Retardation constant (b = 15 nm for glass) |
|
| |
|
D(T) is the ``dead layer'', the part, of typically a few atomic layers,
of the film that is not
superfluid and does not take part in third sound. Below 0.6 K,
D(T) = 1.47 a.l. (1 a.l. = one atomic layer or 0.36 nm.)
Above 0.6 K,
|
D(T) = A + B ·T |
æ
ç
è
|
|
r
rs
|
ö
÷
ø
|
|
| (1.5) |
with A = 0.5 a.l. and B = 1.13 a.l.K-1[7].
In Figure 1.1, the third sound speed on glass is plotted against film
thickness for various temperatures using Equation 1.1.
For ( [(rs)/(r)] )
data is taken from Wilks[18].
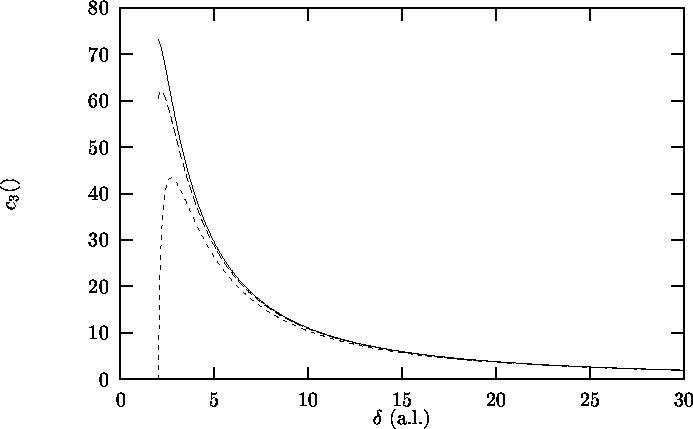
Figure 1.1: Third sound speed c3 in 4He on glass as a function of
film thickness d.
Solid line: T = 0.5 K;
Long dashes: T = 1.0 K;
Short dashes: T = 1.3 K
1.3 Third sound attenuation
The third sound attenuation coefficient a is defined
by the following equation:
with A(x) the amplitude of the third sound wave after running
a distance x. The unit of a is m-1.
Brouwer[4] and Draisma[7] give
an elaborate treatment of the theory
of third sound, including attenuation,
for temperatures above » 1 K.
Distinction is made between finite geometries (with two substrate plates
and 4He films opposite to each other, at a distance of 2 to 50 mm)
and the infinite geometry (with no opposite plate), as used in the experiments
described in Chapter 4.
For thin films, the dominant damping mechanisms are
the thermal waves induced in the 4He vapour and in the
substrate. For thicker films, the acoustic wave in the
vapour becomes the dominant damping mechanism.
The results from this theory, for 4.17 kHz third sound and the infinite geometry,
are presented in Figure 1.2 for a glass substrate
and in Figure 1.3 for a copper substrate.
These calculations were
performed using a program written by Brouwer[5].
The minimums in these plots indicate the transition from the
thin-film to the thick-film region, where the dominant damping
mechanism shifts from thermal to acoustic waves.

Figure 1.2: Attenuation coefficient a on glass as a function of
film thickness d, according to Brouwer[4,5].
n = 4.17 kHz, infinite geometry.
Solid line: T = 1.10 K;
Long dashes: T = 1.21 K;
Short dashes: T = 1.30 K.
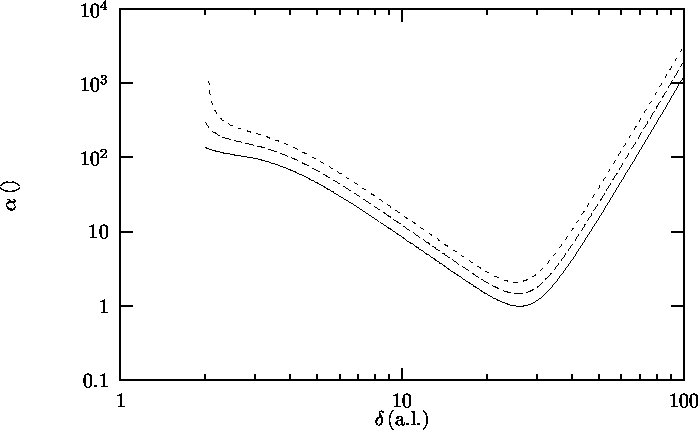
Figure 1.3: Attenuation coefficient a on copper as a function of
film thickness d, according to Brouwer[4,5].
n = 4.17 kHz, infinite geometry.
Solid line: T = 1.10 K;
Long dashes: T = 1.21 K;
Short dashes: T = 1.30 K.
1.4 Film thickness
There are several ways to determine the helium film thickness on the
walls of a container.
The determination can be performed with the use of one of the following
parameters:
- The vapour pressure pv
- The number of 4He atoms in the cell N
- The third sound speed c3.
1.4.1 The vapour pressure pv
At a distance x from a surface, the helium pressure p can be expressed
as [7]
|
p = pv e-[(m W(x))/(kB T)] |
| (1.7) |
Here pv is the vapour pressure in the container,
W is the Van der Waals potential,
kB is Boltzmann's constant and m is the mass of
a 4He atom. The helium film-vapour
interface will appear at a distance d (the film thickness) from the
surface, where pressure p equals the saturated vapour pressure psv:
|
psv = pv e - [(m W(d))/(kB T)] |
| (1.8) |
Rewriting this formula using Equation 1.4 gives
with
The film thickness d can now be calculated recursively using these
formulas if T and pv are measured (because psv depends on T only).
1.4.2 The number of 4He atoms in the cell N
The film thickness d can also be calculated if the total number of 4He atoms
in the film Nfilm is known:
with S the inner area of the container and n the bulk 4He density.
However, the 4He density in the first one or two layers will be higher than the
bulk density because of the strong Van der Waals interaction. To
take this into account Equation 1.11 is rewritten as
Here N0 is the extra number of 4He atoms in the first
one or two layers.
To calculate Nfilm from the total number of 4He atoms in
the cell N the number of 4He atoms in the vapour is required:
Using Equation 1.8 yields:
|
Nvapour = |
psv(T) V
kB T
|
e[(m W(d))/(kB T)] |
| (1.14) |
Since
the following result is obtained:
|
N = N0 + S ·n ·d+ |
psv(T) V
kB T
|
e[(m W(d))/(kB T)] |
| (1.15) |
Rewriting the last equation gives
|
d = |
N
S n
|
- |
N0
S n
|
- |
psv(T) V
kB T
|
e[(m W(d))/(kB T)] |
| (1.16) |
which can be solved recursively to determine d if
N, T, S and V are known.
The value [(N0)/S n] = (0.98 ±0.09) a.l. has been
determined by Draisma [7].
1.4.3 The third sound speed c3
The film thickness can be
calculated recursively using Equation 1.1
if c3 and T are known.
Chapter 2
Phonon modes in thin films recalculated
2.1 Introduction
In third sound experiments, a thin gold film (thickness £ 100 nm)
is often used as a heater to excite the third sound wave [7].
An effect of the thinness of this film on the heat
transfer from the heater to
the substrate was suspected
because, at low temperature T, the typical phonon
wavelength l, calculated with
|
E = kB T = (h/2p) w = (h/2p) c |
ê
ê
|
|
®
k
|
ê
ê
|
= (h/2p) c · |
2 p
l
|
|
|
becomes 160 nm when using T = 1 K and sound velocity c = 3390 m s-1.
This value is of the same order of magnitude as the heater thickness.
Therefore an alternative for the standard
(Debye) phonon distribution function was developed and
tested by Monte Carlo simulation.
Furthermore the Kapitza resistance between the film and another
material was recalculated using the new phonon distribution function.
2.2 A new phonon distribution function
2.2.1 Crystal dimensions
All calculations will be performed assuming the film is a solid of
dimensions V = Lx×Ly×Lz with a cubic lattice with
lattice parameter a. There
are N = Nx×Ny×Nz atoms in the crystal. The speed of
sound in the solid is c.
Only longitudinal phonons will be take into account.
This treatment can easily be generalized to other phonon
polarizations.
The phonon (reciprocal lattice) vectors take the form
[k\vec] = (kx,ky,kz) with
Here the ki are limited to
-[(p)/a] ¼[(p)/a]
and thus the (integer) ni to the values
-[(Ni)/2] ¼[(Ni)/2].
Assuming
Lz << Ly << Lx
it follows
that the values of kx and ky are much more closely spaced than the
values of kz. Therefore kx and ky will be assumed to be
continuous, while kz will be considered discrete.
2.2.2 The density of states over w
The density of states over w (i.e. the number of
phonon states with circular frequency between w and w+dw)
is described [6] under the
approximation of a continuous distribution of [k\vec]-vectors by
In the following treatment discrete values will be used for kz.
First the density of states for a fixed value of kz is calculated.
Then this result is summed for all possible values of
kz.
Because the circular frequency of a phonon mode [k\vec] equals
|
w[k\vec]2 = |
æ
è
|
c |
ê
ê
|
|
®
k
|
ê
ê
|
ö
ø
|
2
|
= c2 ( kx2 + ky2 + kz2 ) |
| (2.3) |
it follows that
|
kx2 + ky2 = |
w[k\vec]2
c2
|
- kz2 |
|
The number of [k\vec]-values with w[k\vec] < w for a fixed
value of kz equals
|
Nw[k\vec] < w = p |
æ
ç
è
|
|
w2
c2
|
- kz2 |
ö
÷
ø
|
|
Lx Ly
(2 p)2
|
|
|
with p( [(w2)/(c2)] - kz2 ) the ``area'' of the
circle in [k\vec]-space and [(Lx Ly)/((2 p)2)] the surface density
of states on that area.
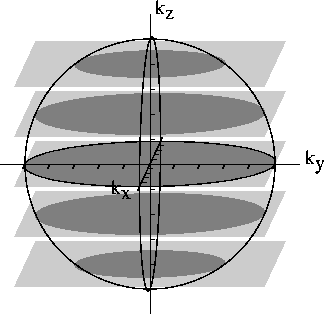
Figure 2.1: Phonon [k\vec]-vectors with w[k\vec] < 5
As an example, in figure 2.1, the sphere depicts
The planes represent constant values of
The dark circles thus represent [k\vec]-vectors with [k\vec]2 < 5.
In this case, kz Î {-4,-2,0,2,4} are the
possible values of kz with w[k\vec] < [(Ö5)/c].
The number of modes with circular frequency between w and
w+dw at the fixed value of kz now equals
For w < c [(2 p)/(Lz)], only the modes with kz = 0 are
present (eq. 2.1 and 2.3),
so g(w) = [(Lx Ly)/(2 pc2)] w
for w < c [(2 p)/(Lz)].
For c [(2 p)/(Lz)] £ w < 2 c [(2 p)/(Lz)], 3 kz-values
are possible (kz = -1,0,1 ·[(2 p)/(Lz)]), etc.
The total number of modes becomes
|
g(w) dw = |
Lx Ly
2 pc2
|
·w· |
æ
ç
è
|
1 + 2 |
ê
ê
ë
|
|
Lz w
2 pc
|
ú
ú
û
|
ö
÷
ø
|
dw |
| (2.4) |
where
ë x
û means the largest integer smaller than or
equal to x.
This equation is tested using Monte Carlo techniques
(section 2.3). Note that for large values of w
equation 2.4 becomes equal to
equation 2.2.
2.2.3 Angular dependence of phonon density
The values of [k\vec] do not have a uniform angular distribution because of the
discreteness of the values of kz. Therefore the phonon density of states
is not only a function of w (depending
on the absolute value of [k\vec] only), but also a function of the phonon
directions.
The density of states in every kx,ky-plane is
[(Lx Ly)/((2 p)2)]
(there is one phonon state in every area [(2 p)/(Lx)] ·[(2 p)/(Ly)]). The Dirac d-function must be used because
the kx,ky-planes lie a distance [(2 p)/(Lz)] apart.
The phonon density of states as a function of [k\vec] is
|
g(kx,ky,kz) dkx dky dkz = |
Lx Ly
(2 p)2
|
· |
å
n Î Z
|
d |
æ
ç
è
|
kz - |
2 p
Lz
|
·n |
ö
÷
ø
|
dkx dky dkz |
| (2.5) |
with Z the set of all integer numbers.
This function is only valid for
sufficiently small values of [k\vec] (see section 2.2.1).
This differential function is transformed into the
new coordinates w,q,f with
Here w is the circular frequency, while q and f are given
by the direction of the phonon.
The density of states as a function of these new variables becomes
|
g(w,q,f) dw dq df = g(kx,ky,kz) · |
w2
c3
|
sinq dw dq df |
|
where [(w2)/(c3)] sinq is the Jacobian of this transformation.
Thus
|
| |
|
|
|
|
Lx Ly
(2 p)2
|
· |
å
n Î Z
|
d |
æ
ç
è
|
w
c
|
cosq- |
2 p
Lz
|
·n |
ö
÷
ø
|
· |
w2
c3
|
sinq dw dq df |
| |
|
|
|
Lx Ly Lz
(2 pc)3
|
· |
å
n Î Z
|
d |
æ
ç
è
|
Lz w
2 pc
|
cosq- n |
ö
÷
ø
|
·w2 sinq dw dq df |
| | (2.7) |
| |
|
Again, this is only valid for w < c [(p)/a]
(then the ki are always smaller than [(p)/a]).
If the discreteness of the values of kz is neglected, the density of
states as a function of [k\vec] becomes
|
gclass(kx,ky,ky) dkx dky dkz = |
Lx Ly Lz
( 2 p)3
|
|
| (2.8) |
Now the density of states as a function of w,q,f becomes
|
gclass(w,q,f) dw dq df = |
Lx Ly Lz
( 2 p)3
|
· |
w2
c3
|
sinq dw dq df |
| (2.9) |
2.2.4 The density of states over w recalculated as a check
The density of states over w is recalculated to check
equation 2.7 by integrating it with respect to
q and f.
|
| |
|
|
|
|
ó
õ
|
p
0
|
dq |
ó
õ
|
2p
0
|
df g(w,q,f) dw |
| |
|
|
|
ó
õ
|
p
0
|
dq |
ó
õ
|
2p
0
|
df |
Lx Ly Lz
(2 pc)3
|
· |
å
n Î Z
|
d |
æ
ç
è
|
Lz w
2 pc
|
cosq- n |
ö
÷
ø
|
·w2 sinq dw |
| |
|
|
|
Lx Ly Lz
(2 pc)3
|
·2 p·w2 |
å
n Î Z
|
|
ó
õ
|
+1
-1
|
dcosq |
2 pc
Lz w
|
d |
æ
ç
è
|
cosq- |
2 pc
Lz w
|
·n |
ö
÷
ø
|
dw |
| |
|
|
Lx Ly
2 pc2
|
·w |
å
n Î Z
|
|
ó
õ
|
+1
-1
|
dcosq d |
æ
ç
è
|
cosq- |
2 pc
Lz w
|
·n |
ö
÷
ø
|
dw |
|
| |
|
The integral in this expression differs from zero only when
or
|
n Î |
é
ê
ë
|
- |
Lz w
2 pc
|
, |
Lz w
2 pc
|
ù
ú
û
|
|
|
Its value then becomes 1. The sum becomes
1 + 2
ë [(Lz w)/(2 pc)]
û , so that
|
g(w) dw = |
Lx Ly
2 pc2
|
·w · |
æ
ç
è
|
1 + 2 |
ê
ê
ë
|
|
Lz w
2 pc
|
ú
ú
û
|
ö
÷
ø
|
dw |
|
which equals equation 2.4.
2.2.5 Taking into account discreteness of ky
If it is assumed that Lz << Ly << Lx
the discreteness of ky can be taken into account,
just like the discreteness
of kz in the previous sections.
The phonon density of states as a function
of [k\vec] now becomes
|
g(kx,ky,kz) dkx dky dkz = |
Lx
2 p
|
|
å
ny Î Z
|
|
å
nz Î Z
|
d |
æ
ç
è
|
ky- |
2 p
Ly
|
ny |
ö
÷
ø
|
d |
æ
ç
è
|
kz- |
2 p
Lz
|
nz |
ö
÷
ø
|
dkx dky dkz |
|
and as a function of w, q, f
|
| |
| | |
|
|
|
Lx Ly Lz
( 2 pc )3
|
|
å
ny Î Z
|
|
å
nz Î Z
|
d |
æ
ç
è
|
Ly w
2 pc
|
sinqsinf- ny |
ö
÷
ø
|
d |
æ
ç
è
|
Lz w
2 pc
|
cosq- nz |
ö
÷
ø
|
· |
| |
|
|
| |
|
The distribution function over w will be calculated in the region
where w < 2 pc / Lz, so kz = 0.
|
| |
| | |
|
|
|
ó
õ
|
p
0
|
dq |
ó
õ
|
2p
0
|
df |
Lx Ly Lz
( 2 pc )3
|
|
å
ny Î Z
|
|
å
nz Î Z
|
d |
æ
ç
è
|
Ly w
2 pc
|
sinqsinf- ny |
ö
÷
ø
|
d |
æ
ç
è
|
Lz w
2 pc
|
cosq- nz |
ö
÷
ø
|
· |
| |
|
| |
|
|
|
Lx Ly Lz
( 2 pc )3
|
|
ó
õ
|
2p
0
|
df |
ó
õ
|
+1
-1
|
dcosq |
2 pc
Lz w
|
|
å
ny Î Z
|
d |
æ
ç
è
|
Ly w
2 pc
|
sinqsinf- ny |
ö
÷
ø
|
d(cosq) w2 dw |
| |
|
|
|
Lx Ly
( 2 pc )2
|
|
å
ny Î Z
|
|
2 pc
Ly w
|
|
ó
õ
|
2p
0
|
df d |
æ
ç
è
|
sinf- |
2 pc
Ly w
|
ny |
ö
÷
ø
|
w dw |
| |
|
|
Lx
2 pc
|
|
å
ny Î Z
|
|
ó
õ
|
2p
0
|
df d |
æ
ç
è
|
sinf- |
2 pc
Ly w
|
ny |
ö
÷
ø
|
dw |
| (2.10) |
| |
|
To calculate the integral over f, the integration interval is first
changed into [ -p/2, 3p/2 ] and then split into two parts :
|
| |
| |
|
ó
õ
|
2p
0
|
df d |
æ
ç
è
|
sinf- |
2 pc
Ly w
|
ny |
ö
÷
ø
|
= |
| |
|
|
|
ó
õ
|
[(p)/2]
-[(p)/2]
|
df d |
æ
ç
è
|
sinf- |
2 pc
Ly w
|
ny |
ö
÷
ø
|
+ |
ó
õ
|
[3/2] p
[(p)/2]
|
df d |
æ
ç
è
|
sinf- |
2 pc
Ly w
|
ny |
ö
÷
ø
|
|
| |
|
|
|
ó
õ
|
1
-1
|
dsinf |
|
d |
æ
ç
è
|
sinf- |
2 pc
Ly w
|
ny |
ö
÷
ø
|
cos(arcsin(sinf))
|
- |
ó
õ
|
1
-1
|
dsinf |
|
d |
æ
ç
è
|
sinf- |
2 pc
Ly w
|
ny |
ö
÷
ø
|
cos(p- arcsin(sinf))
|
|
| |
|
|
2 |
ó
õ
|
1
-1
|
d x |
|
d |
æ
ç
è
|
x - |
2 pc
Ly w
|
ny |
ö
÷
ø
|
cos(arcsinx )
|
|
| |
|
|
ì
ï
ï
ï
í
ï
ï
ï
î
|
|
|
|
2
|
|
Ö
|
1 - ([(2 pc)/(Ly w)])2 ny2
|
|
|
| |
if | [(2 pc)/(Ly w)] ny | £ 1 |
|
| |
|
|
| (2.11) |
| |
|
This gives the final result
|
g(w) dw = |
Lx
pc
|
|
æ
ç
ç
ç
è
|
1 + |
ë | [(Ly w)/(2 pc)] |
û
å
n = 1
|
|
2
|
|
Ö
|
1 - ([(2 pc)/(Ly w)])2 n2
|
|
ö
÷
÷
÷
ø
|
|
| (2.12) |
This equation is checked by Monte Carlo simulation
in section 2.3.
In the rest of this chapter,
the discreteness of kywill not be taken into account.
Only the discreteness of kzwill be taken into account because
in the experiments described in Chapters 3 and 4
the effects of the discreteness of ky are too small to play a
role of importance. (With Ly = 0.1 mm, the discrete steps in
ky are sized [(2 p)/(Ly)] = 63 m-1, which corresponds to
(with c = 3390 m s-1)
an energy of E = (h/2p) c ky = 2.3·10-29 J. This is small
compared to the thermal energy at
T = 1 K, E = kB T = 1.4 ·10-23 J).
2.2.6 The density of states over q
The density of states over q (i.e. the number of phonon states with
q between q and q+ dq) is calculated by
integrating g(w,q,f) with respect to w and f.
Only values of [k\vec] with w[k\vec] smaller than a given W will be taken
into account, because the modes will be occupied with a Bose-Einstein
distribution, which doesn't allow a noticable number of phonons above a
certain energy. The Bose-Einstein distribution will be used in
section 2.4 to calculate the equilibrium occupation of
the phonon state at a given temperature and hence the heat flux.
In the following treatment the case q = p/2, phonons
with kz = 0 will be excluded. This case will be examined at the end
of this section.
|
| |
|
|
|
|
ó
õ
|
W
0
|
dw |
ó
õ
|
2p
0
|
df g(w,q,f) dq |
| |
|
|
|
ó
õ
|
W
0
|
dw |
ó
õ
|
2p
0
|
df |
Lx Ly Lz
(2 pc)3
|
· |
å
n Î Z
|
d |
æ
ç
è
|
Lz w
2 pc
|
cosq- n |
ö
÷
ø
|
·w2 sinq dq |
| |
|
|
|
Lx Ly Lz
(2 p)2 c3
|
sinq· |
å
n Î Z
|
|
ó
õ
|
W
0
|
dw |
ê
ê
ê
|
|
2 pc
Lz cosq
|
ê
ê
ê
|
d |
æ
ç
è
|
w- |
2 pc
Lz cosq
|
·n |
ö
÷
ø
|
w2 dq |
| |
|
|
|
Lx Ly
2 pc2
|
· |
sinq
| cosq|
|
· |
å
n Î Z
|
|
ó
õ
|
W
0
|
dw d |
æ
ç
è
|
w- |
2 pc
Lz cosq
|
·n |
ö
÷
ø
|
w2 dq |
| | (2.13) |
| |
|
The integral in this last equation will yield wn2 with
provided
For cosq > 0 it follows
|
n Î |
é
ê
ë
|
0, |
WLz cosq
2 pc
|
ù
ú
û
|
ÇZ |
|
and for cosq < 0
|
n Î |
é
ê
ë
|
|
WLz cosq
2 pc
|
, 0 |
ù
ú
û
|
ÇZ |
|
This yields that
|
| |
|
|
|
|
Lx Ly
2 pc2
|
· |
sinq
| cosq|
|
· |
ë | [(WLz cosq)/(2 pc)] |
û
å
n = 0
|
|
æ
ç
è
|
|
2 pc
Lz cosq
|
ö
÷
ø
|
2
|
·n2 dq |
| |
|
|
Lx Ly
2 pc2
|
· |
sinq
| cosq|
|
· |
æ
ç
è
|
|
2 pc
Lz cosq
|
ö
÷
ø
|
2
|
|
ë | [(WLz cosq)/(2 pc)] |
û
å
n = 0
|
n2 dq |
|
| |
|
Because åk = 0n k2 = [1/6] n (2n2 + 3n + 1) our final
result is
|
gW(q) dq = |
Lx Ly
Lz2
|
· |
sinq
| cos3q|
|
· |
p
3
|
n (2n2 + 3n + 1) dq with n = |
ê
ê
ë
|
|
ê
ê
ê
|
|
WLz cosq
2 pc
|
ê
ê
ê
|
ú
ú
û
|
|
| (2.14) |
This distribution is presented in Figure 2.5 (solid line).
Note that if W < 2 pc / Lz then n = 0 so
gW(q) dq = 0 for all q ¹ p/2.
This means that there are no modes with energy
(h/2p) w < 2 pc (h/2p) / Lz that have a component in
the kz-direction. Recalling the example in Figure 2.1,
w < 2 pc/Lz means that the sphere gets smaller than the
spacing between the planes and does not have an intersection with
other planes than kz = 0.
Also note that the preceding treatment is only
valid for q ¹ [(p)/2], because then cosq = 0.
Of course there are a lot of possible modes with q
exactly equal to [(p)/2], since this corresponds with
the kz = 0-plane.
The number of modes with q = [(p)/2],
Nw < W; q = [(p)/2]; 0 £ f £ 2 p,
can be calculated as follows:
|
| |
|
|
|
|
lim
D® 0
|
|
ó
õ
|
W
0
|
dw |
ó
õ
|
[(p)/2]+D
[(p)/2]-D
|
dq |
ó
õ
|
2 p
0
|
df |
Lx Ly Lz
( 2 pc )3
|
· |
å
n Î Z
|
d |
æ
ç
è
|
|
Lz w
2 pc
|
cosq- n |
ö
÷
ø
|
·w2 sinq |
| |
|
|
|
lim
D® 0
|
|
ó
õ
|
W
0
|
dw |
Lx Ly Lz
4 p2 c3
|
· |
å
n Î Z
|
|
ê
ê
ê
|
|
2 pc
Lz w
|
ê
ê
ê
|
|
ó
õ
|
[(p)/2]+D
[(p)/2]-D
|
dq d |
æ
ç
è
|
cosq- |
2 pc
Lz w
|
·n |
ö
÷
ø
|
·w2 sinq |
| |
|
|
|
lim
D® 0
|
|
ó
õ
|
W
0
|
dw |
Lx Ly
2 pc2
|
· |
å
n Î Z
|
|
ó
õ
|
cos( [(p)/2]+D)
cos( [(p)/2]-D)
|
d cosq d |
æ
ç
è
|
cosq- |
2 pc
Lz w
|
·n |
ö
÷
ø
|
·w |
| |
|
| |
|
| (2.15) |
| |
|
Equations 2.14 and 2.15 will also be
checked with a Monte Carlo-simulation in section 2.3.
If the classical phonon distribution function of Equation 2.9
is used, calculation of the density of states over q gives
|
| |
|
|
|
|
ó
õ
|
W
0
|
dw |
ó
õ
|
2p
0
|
df gclass(w,q,f) dq |
| |
|
|
|
ó
õ
|
W
0
|
dw |
ó
õ
|
2p
0
|
df |
Lx Ly Lz
( 2 p)3
|
· |
w2
c3
|
sinq dq |
| |
|
|
Lx Ly Lz
( 2 p)2 c3
|
· |
W3
3
|
sinq dq |
| (2.16) |
| |
|
Taking the Lz ® ¥ limit of Equation 2.14 gives
the same result.
2.3 Monte Carlo simulations
The idea of using Monte Carlo techniques to check our calculations
was first conceived after finding
Equation 2.4 and its unexpected discontinuities. It was decided to
generate a large number of phonon [k\vec]-vectors of the form [k\vec] = (kx,ky,kz)
with ki = [(2 p)/(Li)] ni and to choose a random integer number in the
range -[(Ni)/2] ... [(Ni)/2] for each ni (see
section 2.2.1). With a large number of such random
[k\vec]-vectors, a good approximation of the phonon distribution function
g(w,q,f)
will be generated.
Next, all these [k\vec]-vectors can be classified with
respect to their values of w, q and f to generate,
for instance, the density of states over w.
In figures 2.2 to 2.4, g(w) from
these Monte Carlo simulations is plotted against w. The material
properties have been chosen to resemble a gold strip of dimensions
30 mm × 0.1 mm × 100 nm with c = 3390 m s-1 and
a = 0.257 nm.
The three figures plot the same function but on a different w-scale:
Figure 2.2 for w < 1014 s-1,
Figure 2.3 for w < 1012 s-1 and
Figure 2.4 for w < 109 s-1.
In Figure 2.2, it is demonstrated that, for w >> c[(2 p)/(Lz)] but w < c [(p)/a] Monte Carlo simulation
gives the same results for g(w) as the classical result of
equation 2.2. For w > c [(p)/a] the
finite crystal dimensions that the classical approximation does not take
into account causes a breakdown of g(w).
In Figure 2.3 the discrete steps of Equation 2.4
can be seen both in the analytical results and in the Monte Carlo
simulation. In Figure 2.4, on an even smaller scale,
the discontinuities of Equation 2.12 are shown to comply
with the Monte Carlo simulation.
In figure 2.5, the distribution function over theta
gW(q) is plotted. An upper limit
W = 1 ·1012 s-1 was used. The figure shows the
correspondence
between Equation 2.14 and the Monte Carlo simulation.
The number of modes with q = p/2 also agrees with the
analytical result from Equation 2.15.
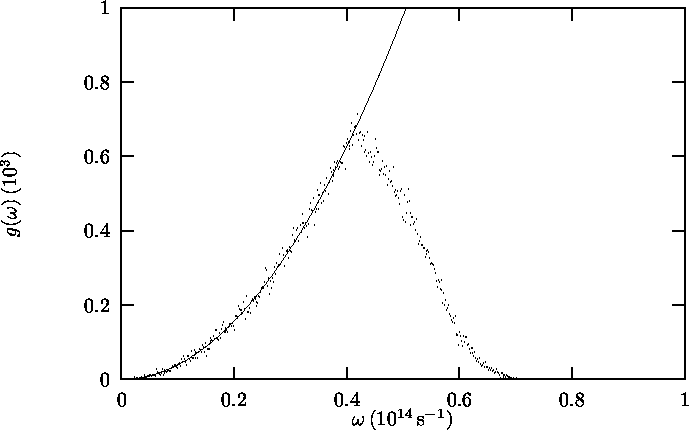
Figure 2.2: Distribution function over w for
w < 1014 s-1.
Solid line: Classical function (Equation 2.2),
coinciding with the new phonon distribution function (Equation 2.4).
points: Monte Carlo simulation
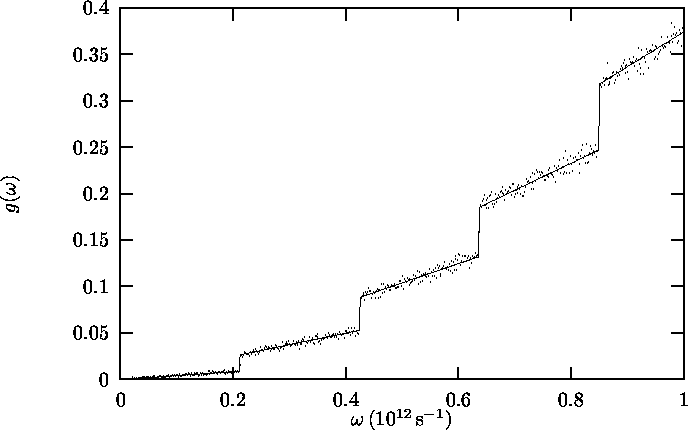
Figure 2.3: Distribution function over w for w < 1012 s-1.
Solid line: Taking into account discreteness of kz
(equation 2.4); points: Monte Carlo simulation
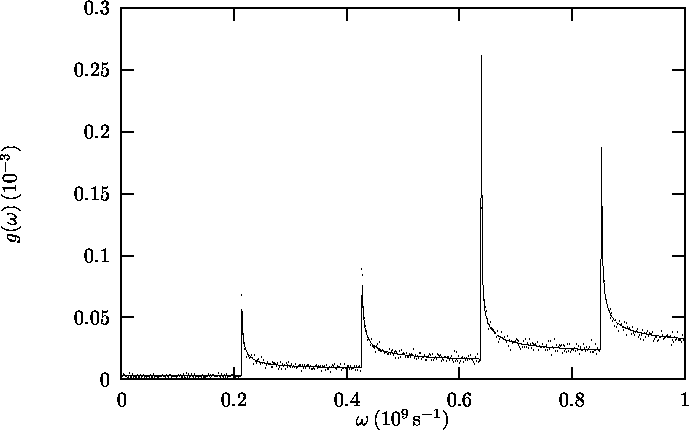
Figure 2.4: Distribution function over w for w < 109 s-1.
Solid line: Analytical, taking into account discreteness of kz and ky
(equation 2.12); points: Monte Carlo simulation
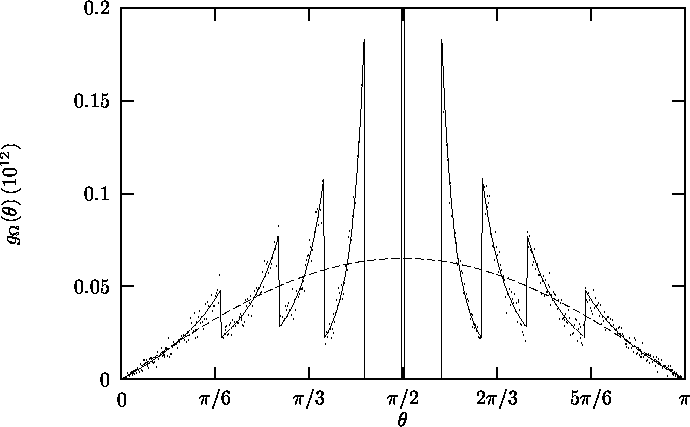
Figure 2.5: Distribution function over q for w < 1012 s-1.
Solid line: Analytical (Equation );
dashed line: Classical results (Equation );
points: Monte Carlo simulation
2.4 Kapitza resistance
In the experiments described in Chapter 4 a thin gold heater
of approx. 100 nm
thickness and surface dimensions 0.1 mm × 30 mm, sputtered on
a glass substrate, was used to excite a third sound wave in a Helium film.
In this section
the effects of the new phonon distribution function on
the heat flux [Q\dot] through the gold-glass interface will be
considered.
Hereafter the new distribution function will be used to
recalculate the thermal (Kapitza) resistance.
The expression for the heat flux from a thin heater
of dimensions V = Lx ×Ly ×Lz, with the interface
to the substrate in the z-direction, is (from [12])
|
|
.
Q
|
= A · |
ó
õ
|
¥
0
|
dw |
ó
õ
|
[(p)/2]
0
|
dq |
ó
õ
|
2p
0
|
df |
g(w,q,f)
V
|
· fBE( b(h/2p) w) · (h/2p) w· c · cosq· a(q) |
| (2.17) |
with
|
| |
|
|
| |
|
| |
|
| |
|
| |
|
|
thermodynamic temperature of the crystal |
| |
|
| |
|
|
fraction of phonons, coming in at an angle q, |
| |
|
| that cross the interface (see [11]) |
|
| |
|
Filling in the phonon distribution function (eq. 2.7) yields
|
| |
|
|
|
|
(h/2p) A
(2 pc)2
|
|
ó
õ
|
[(p)/2]
0
|
dq a(q) sinqcosq· |
å
n Î Z
|
|
ó
õ
|
¥
0
|
dw |
w3
eb(h/2p) w-1
|
d |
æ
ç
è
|
Lz w
2 pc
|
cosq- n |
ö
÷
ø
|
|
| |
|
|
|
(h/2p) A
2 pc Lz
|
|
ó
õ
|
[(p)/2]
0
|
dq a(q) sinq· |
å
n Î Z
|
|
ó
õ
|
¥
0
|
dw |
w3
eb(h/2p) w-1
|
d |
æ
ç
è
|
w- |
2 pc
Lz cosq
|
·n |
ö
÷
ø
|
|
| |
|
|
(h/2p) A
2 pc Lz
|
|
ó
õ
|
[(p)/2]
0
|
dq a(q) sinq· |
¥
å
n = 1
|
|
wn3
eb(h/2p) wn-1
|
with wn = |
2 pc
Lz cosq
|
·n |
|
| |
|
Here wn is the frequency of a phonon, coming in at an angle q,
with kz on the n-th kz-plane.
If the dimensionless function x(q) is defined
to be
[(2 pb(h/2p) c)/(Lz cosq)] = [(b(h/2p) wn)/n], the energy spacing (relative to kB T) between the phonon modes
with the same q but with different kz,
then
|
|
.
Q
|
= |
(2 pc)2 (h/2p) A
Lz4
|
· |
ó
õ
|
[(p)/2]
0
|
dq a(q) |
sinq
cos3q
|
|
¥
å
n = 1
|
|
n3
ex(q)n-1
|
|
| (2.18) |
Note that the case q = p/2 causes us no trouble now, because
the phonons with kz = 0 don't contribute to the heat flux.
In the classical limit, Lz ® ¥ or T ® ¥ so
x® 0 and ån = 0¥ ® ò0¥dn,
|
| |
|
|
|
|
(2 pc)2 (h/2p) A
Lz4
|
· |
ó
õ
|
[(p)/2]
0
|
dq a(q) |
sinq
cos3q
|
· x(q)-4 |
ó
õ
|
¥
0
|
dx |
x3
ex -1
|
|
| |
|
|
p2 kB4 T4 A
60 (h/2p)3 c2
|
· |
ó
õ
|
[(p)/2]
0
|
dq a(q) sinqcosq |
| (2.19) |
| |
|
which corresponds to the results of
Khalatnikov[11] and Little[12].
2.4.2 Kapitza resistance
Because the heat flux in the classical limit is proportional to
A T4, Equation 2.19 can be rewritten for the heat flux from
the heater to the substrate to
with RK the Kapitza resistivity.
With the principle of detailed balance it can be concluded that the
balance heat flux
from the heater (temperature TH) to the substrate (temperature
TL) equals
For small temperature difference DT = TH - TL,
DT << TL, the thermal resistance become
so that the thermal resistance is proportional to T-3.
Using the new phonon distribution function,
a thermal resistance, implied in equation 2.18, can also be defined:
|
R º |
DT
|
= |
æ
ç
ç
ç
è
|
|
dT
|
ö
÷
÷
÷
ø
|
-1
|
|
| (2.23) |
In figure 2.6, the thermal resistance is plotted against the
temperature, both for the ``classical'' results of equation 2.22
and using equation 2.23.
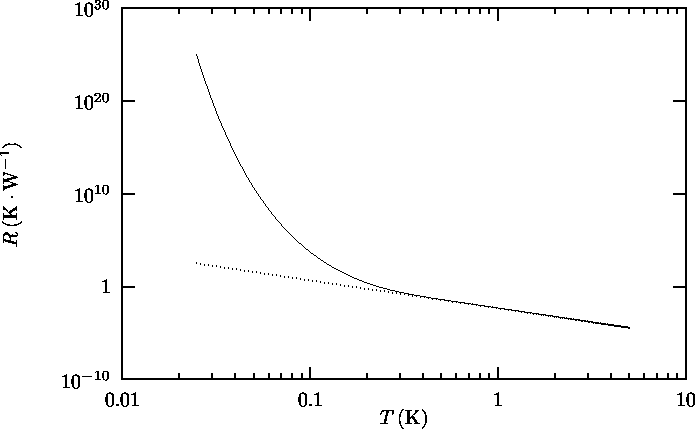
Figure 2.6: Thermal resistance R (Kapitza resistance) between 100 nm thick gold
heater and glass substrate as a function of T.
Dotted line: According to equation
(classical T-3 law);
Solid line: According to equation
(Taking into account discreteness of kz)
In this figure, the fraction a is assumed to be (from [12])
|
a1(q1) = |
|
|
4 r2 c2
r1 c1
|
· |
cosq2
cosq1
|
|
|
æ
ç
è
|
|
r2 c2
r1 c1
|
+ |
cosq2
cosq1
|
ö
÷
ø
|
2
|
|
|
| (2.24) |
with
|
| |
|
|
| |
|
|
19.7 ·103 kgm-3, the density of the film material (gold) |
| |
|
|
2.32 ·103 kgm-3, the density of the substrate material (glass) |
| |
|
|
3390 m s-1, the speed of sound in gold |
| |
|
| 5640 m s-1, the speed of sound in glass |
|
| |
|
2.5 Discussion
The new phonon distribution function presented in Equation 2.7
correctly defines the phonon distribution for a thin film as
described in section 2.2.1. For temperatures
below (typically) 1 K the new distribution function results
in a dramatical increase in the Kaptiza resistance between
the film (or heater) and an underlying bulk material
(or substrate) (Figure 2.6).
A physical explanation for this result comes from the discreteness of
the values of kz introduced in the new phonon distribution function.
When phonons can have only discrete values of kz
(kz = ni ·2 p/Lz, Section 2.2.2), phonons
with kz ¹ 0 will have an energy of at least
(h/2p) w = (h/2p) c k = 2 pc (h/2p) / Lz.
With thin films (small Lz) and low temperatures
(kB T << 2 pc (h/2p)/Lz),
phonons with kz ¹ 0 will not be excited, so only phonons with
kz = 0 will be present. Phonons with kz = 0 do not contribute
to the heat transfer from the heater to the surface,
because they do not cause atoms to move in the z-direction.
This means that if mostly phonons with kz = 0 are present, the
heat transfer will decrease dramatically with decreasing temperature.
2.5.1 Experimental support
In the experimental setup described in
Section 3.5
the heater is not in direct contact
with the substrate, because it is sputtered onto a
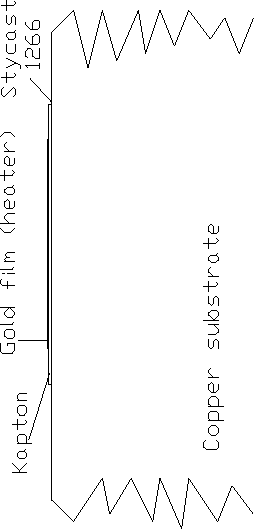
thin Kapton foil which is glued to a copper substrate
(Figure 3.7).
In this case there are two extra layers between the heater and
the substrate (Kapton and Stycast 1266 glue). Because these layers will
be at a lower temperature than the heater, their Kapitza resistance
will be higher. If this effect occurs, the heat leak from the heater
to the substrate will be low compared to the ``classical'' case
where the effects of the new phonon distribution are not taken
into account. This means that more heat will be delivered to
the 4He film, making third sound excitation easier!
Mester et.al. [13] describe experiments on heat
transport between solids and superfluid 4He films.
In these experiments the heat flux is dissipated by evaporation
of 4He atoms.
They find a giant
effective Kapitza resistance (3 orders of magnitude greater than
for bulk helium), but no dependence of the Kapitza resistance
on film thickness.
This indicates that the phonon distribution
as described in this chapter is not responsible for the
giant Kapitza resistance found by Mester since the Kapitza
resistance depends on the heat flux (Equation 2.23)
which in turn depends on film thickness Lz (Equation 2.18).
Eggenkamp [8] found an increasing thermal
resistance between a gold heater film and a 4He film for temperatures
below 0.60 K. Here evaporation and third sound are the
dissipation mechanisms. Eggenkamp found a thickness dependence
of the heat transport, although only 2.5 a.l. and 1.9 a.l. films
were studied. However,
Eggenkamps experiments describe heat transport from a
gold heater film to a superfluid 4He film.
The theory presented in this chapter is able to describe
the phonon distribution in the heater, but it is not able
to describe the heat transfer from the heater to the 4He film.
2.5.2 Suggestions for improvement
In this chapter only longitudinal phonon modes of a cubic lattice are
considered. This model should be extended to other lattices and
other phonon polarizations.
Quantum effects due to the small dimensions of the
gold film should be taken into account as well. For instance, quantum
tunneling of phonons through the interface could play a role.
Excitations in superfluid 4He films (phonons and rotons)
should be considered in order to be able to apply this model to
the experiments of Eggenkamp and to the experiments described in
Chapter 4.
Chapter 3
Experimental set-up
3.1 Cryogenics
Third sound experiments with 4He have to be done at temperatures around or
below 1.3 K, because otherwise third sound is strongly attenuated
due to the 4He vapour. To reach 1.3 K,
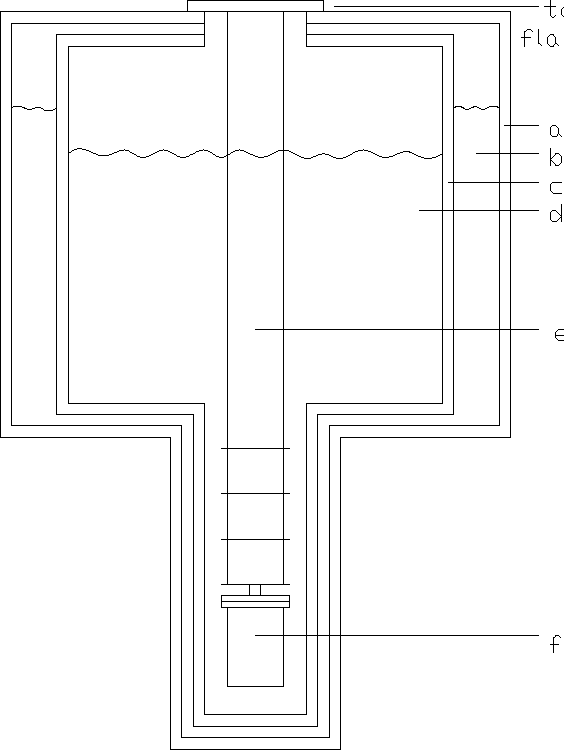
a pumped 4He cryostat is used
(Figure 3.1).
It consists
of a set of stainless steel vessels placed inside each other. The
outermost is vacuum, the one inside it is filled with liquid
nitrogen at 77 K. Inside the nitrogen vessel there is a vacuum
vessel again and the innermost vessel is filled with
liquid helium. The vapour in this vessel is pumped away to reach a minimum
temperature of about 1.19 K. The experimental cell is hanging in this
helium bath.
Figure 3.1: Pumped 4He cryostat. a. Vacuum chamber
b. Nitrogen bath c. Vacuum chamber d. Helium bath e. Insert f. Cell
3.2 The cell
The copper cell made by Pinkse [14] was used in the
experiments.
It has enough space for a (10.8 ±0.6) m2
copper sinter, also made by Pinkse. The sinter is needed to stabilize
the 4He film thickness inside the cell and thermally anchor the film
to the cell.
The cell also features a feedthrough for electrical wiring of which
19 connections are still usable.
Figure 3.2: Experimental cell. a. Cell top b. Feedthrough c. Filling capillary
d. Indium ring e. Bottom plate f. Left frame g. Right frame h. Glass and
copper bars i. Thermometers j. Platform k. Sinter holder l. Sinter
m. Thermometer n. Pressure gauge o. Cell bottom
A new interior for the cell was designed, capable of holding
both a copper and a glass resonator bar at the same time
(see Figure 3.2 and detail on front page).
The following parts were made for this interior:
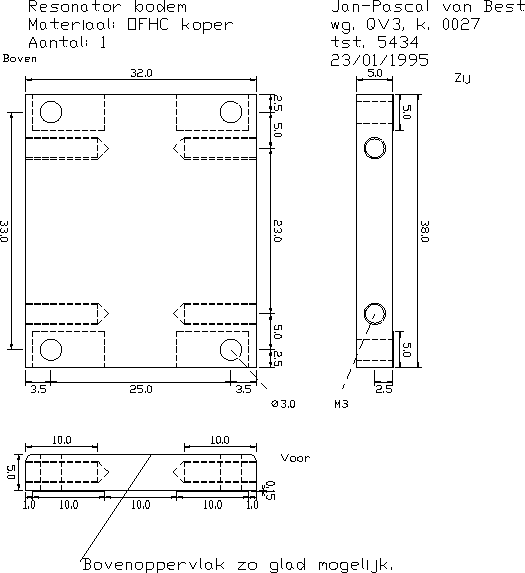
- A copper bottom plate, which is screwed to the top flange of
the cell (Appendix, figure A.1).
- A copper resonator bar (Appendix, figure A.4).
- A glass resonator bar (Appendix, figure A.5).
- Two frames that together hold both bars
(Appendix, figure A.2 and A.3).
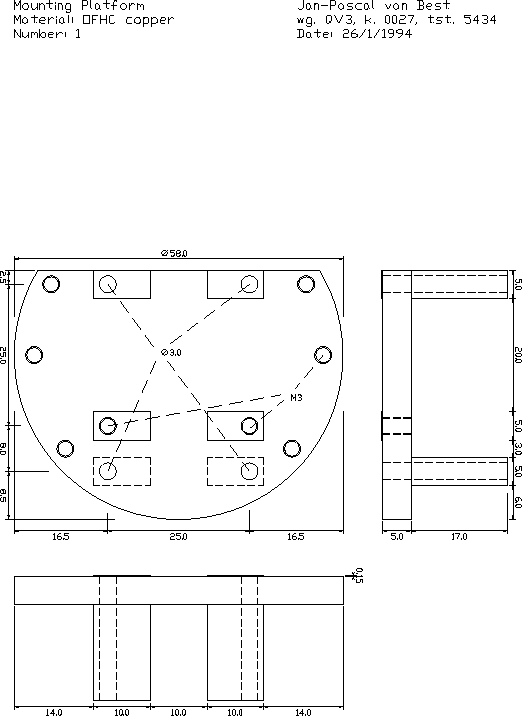
- A mounting platform that can be screwed to the bottom plate
(Appendix, figure A.6). Pinkse's
copper sinter can be screwed to this platform.
The cell also features a sapphire capacitive pressure gauge,
hanging in the free space below the sinter, and four
resistor thermometers. One thermometer is fitted to the frame, two
are glued to both bars and one is hanging in the helium bath.
3.3 The bar geometry
Both bars have a diameter of 10 mm and a length of 30 mm.
They are suspended above the (silver-plated copper) bottom plate
at distance of about 15 mm for the copper bar and about 32 mm for the glass bar.
Both bars feature a mechanism for third sound excitation and third sound
detection. Third sound is excited by a heater (H1 and H2 in
Figure 3.3) and detected using a detector capacitance (D1 and
D2). The excitation and detection mechanism are described in
sections 3.5 and 3.6.
A third sound wave, excited at one of the heaters,
would travel both up and down. The wave that starts moving down would reach
the detector after running along a quarter of the bar circumference. After
running completely around the bar, it would reach the detector again after
5/4 of the bar circumference, and again at 9/4, 13/4, etc.
The wave that starts moving up would reach the detector after
3/4 of the bar circumference, and again at 7/4, 11/4, etc.
In this way a signal
can be expected at the detector after 1/4, 3/4, 5/4, 7/4, etc. times
the time needed to complete one loop around the bar.
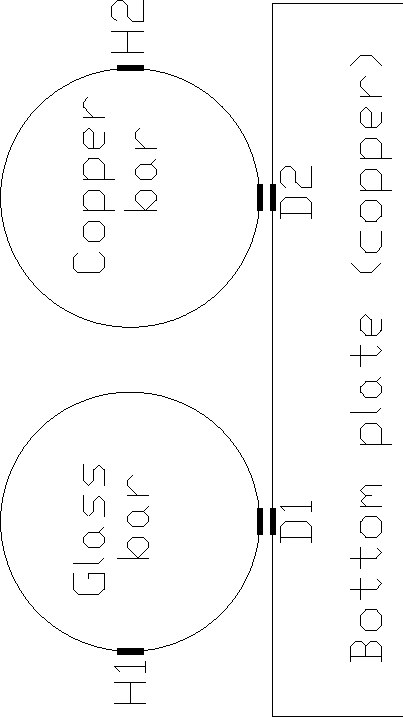
|
Figure 3.3: Twin bars setup
3.4 Electrolytic polishing of copper
The copper resonator bar needed to be polished in order to
have a clean third sound signal. If the surface is
rough, the circumference of the cylinder will vary from place
to place. This will cause a difference in time needed by a third
sound pulse to travel around the cylinder, resulting in a
distorted signal.
Mechanically polishing copper is very hard,
because the material is soft. In this case it is even harder
because the item to be polished is a copper cylinder .
The solution chosen was to use a technique called electrolytic
polishing[17].
Electrolytic polishing (or electropolishing ) provides
the following two effects on the surface to be polished:
- ``smoothing'' of the surface by elimination of the large-scale
irregularities (above 1 mm in size)
- ``brightening'' by removal of the smaller irregularities
(down to a around 10 nm).
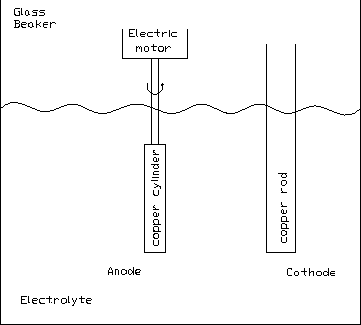
The item to be polished (in our case the copper cylinder) forms the
anode in an electrolytic cell (Figure 3.4).
The item is first mechanically polished with
sandpaper of successively finer grade (up to 4000).
A solution of 70% orthophosphoric acid
(H3PO4) in water is used as electrolyte.
Figure 3.4: Setup for electropolishing the copper bar
The electric motor rotates the anode (the copper bar) with a frequency
of about 1 Hz.
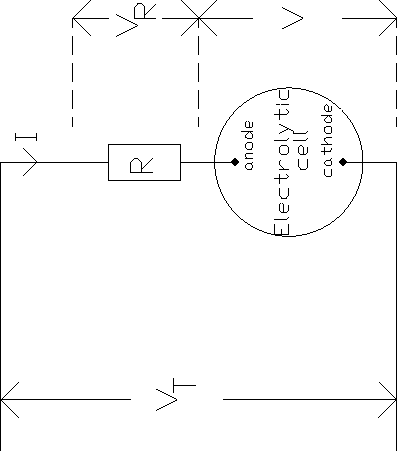
The electrical circuit used is presented in Figure 3.5.
Figure 3.5: Electrical circuit for electropolishing
Here R is a 1 W resistor used to measure the current
running through the cell, VR is the voltage
across this resistor, V is the voltage across the cell and
VT = VR + V is the voltage across the total circuit.
By using an X,Y-recorder with V on the
X input and VR on the Y input it is possible to measure the
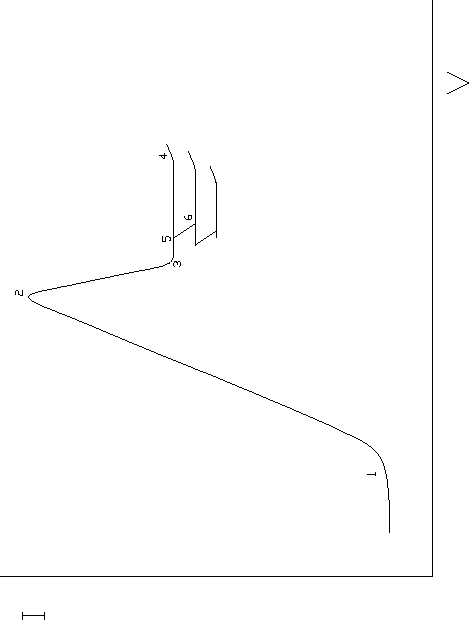
I,V-diagram of the electrolytic cell. A typical I,V-diagram
is presented in Figure 3.6.
Figure 3.6: Typical electropolishing I,V-diagram
In this diagram a number of stages can be recognised
and the procedure for electropolishing is as follows:
- Start increasing VT. This causes I to increase. In this stage
the anode surface is etched. This results in impairment of the anode surface
and should last as short a time as possible.
- At a certain moment, a blue, translucent viscous layer starts to
form on the anode surface.
This layer probably consists of copper phosphates. It is this layer
that controls the polishing process.
The current I will drop
because the viscous layer increases the cell resistance.
VT is now held constant.
The cell resistance still increases, resulting in a drop of I,
a decrease of VR and
consequently an increase of V.
- When the viscous layer is completed, the current reaches equilibrium.
Increasing VT a little again reveals the ``polishing plateau'',
where I does not depend on V. The viscous layer limits the current.
The anode surface is now being polished. Total cell voltage is about 2.5 V.
To check this condition, VT is increased further.
- If VT is increased too far the
polishing plateau ends. Gas evolution occurs, destroying the
viscous layer and pitting the anode surface.
The destruction of the viscous layer allows the current to rise again.
The total voltage VT is quickly decreased to avoid pitting.
- After some time, the current I will decrease again slowly,
probably because the viscous layer still grows a little.
This decrease of I causes a corresponding rise of V,
like at point 2.
- Increasing VT reveals the polishing plateau again.
Find the end of the plateau to make sure the anode is still
being polished and go back.
- Repeat steps 5 and 6 for about 15 minutes. The item is removed
from the electrolyte approximately every 5 minutes for washing
with distilled water.
There are a number of practical points to be observed when electropolishing:
- It should be possible to insert and remove the item to be polished
quickly from the electrolyte (for washing purposes).
- Either rotate the anode or stir or rotate the electrolyte. This allows
fresh electrolyte to reach the anode. Do not rotate too fast, because
this may destroy the viscous layer.
- Make sure the item is in contact
with the electrolyte only when the required potential difference across the
cell is present, since otherwise etching may occur.
Use a test piece to determine the appropriate voltage.
- The relative position of the anode to the cathode should remain
fixed during the treatment. If this position shows variations, the
internal resistance of the cell will also variate, which will make it
make difficult to maintain polishing conditions.
- At the cathode, gas evolution will occur. Take care this will not
destroy the viscous layer at the anode.
- Remove the item from the electrolyte every 5 minutes, wash with
distilled water.
- After polishing, quickly remove the item from the electrolyte
and wash with distilled water and alcohol.
- Getting the ``feeling''
for electropolishing takes some time. First practice on some test pieces
and see how they get severely pitted if the voltage gets too high.
The copper bar used in the cell was polished
brightly overall, but still has a few pits.
Further polishing was not thought to be a good idea because the diameter
of the bar had already decreased from 10.0 mm to
9.6 mm as a result of repeated etching and polishing.
3.5 Excitation of third sound
Thermal excitation is used to excite a third
sound pulse on the bar. A
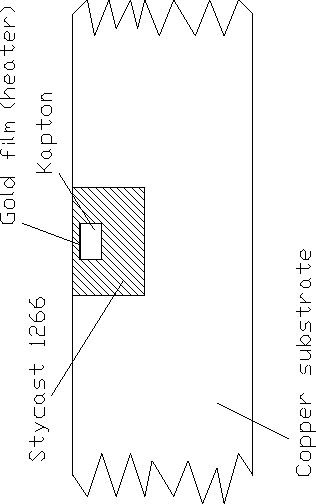
0.2 mm wide and 30 mm long gold electrode (the ``heater'') was sputtered
on the side
of both bars. On the copper bar, a 13 mm thick piece of Kapton
foil was first glued to the copper as insulation. The heater was then
sputtered on the Kapton (Figure 3.7).
Figure 3.7: Heater on copper
By sending one half-sine current pulse through
the heater, a third sound pulse can be excited.
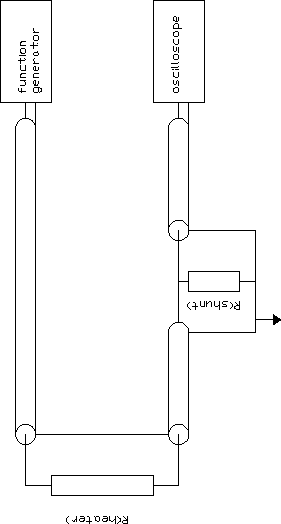
Figure 3.8: Excitation electronics
In Figure 3.8, the excitation electronics are drawn.
Rheater is measured using a four-point method. The current through
the heater can be measured by measuring the voltage across Rshunt on
the oscilloscope. If that voltage is V, then the current I through the
heater equals
The energy dissipated in the heater in one half-sine equals
|
| |
|
|
|
|
ó
õ
|
[1/2f]
0
|
Rheater ·( I ·sin2 pf t )2 dt |
| |
|
| |
|
|
1
4f
|
·Rheater · |
æ
ç
è
|
|
V
Rshunt
|
ö
÷
ø
|
2
|
|
|
| |
|
with f the frequency of the half-sine (typically 3 kHz).
3.6 Detection of third sound
In both gaps between the bars and the bottom plate a capacitor was constructed
by sputtering 1 mm wide electrodes on the bar and on the bottom plate, where
necessary of course insulated by a layer of Kapton. Because of the
relative dielectric constant of 4He at 1.3 K, er = 1.055,
the capacitance will change when a third sound pulse passes the detector.
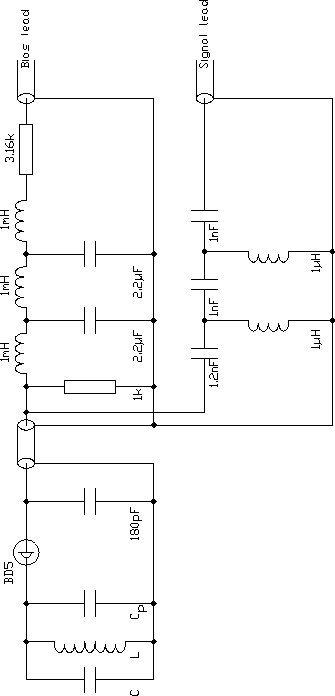
The detector capacitor C is combined with an inductance L in an
LC-oscillator circuit (Figure 3.9). A change in capacitance results
in a change in resonant frequency by w2 L C = 1. A BD5 tunnel diode
is used to drive the oscillator circuit and compensate its losses.
The schematics for
the tunnel diode oscillator and filtering circuits are also given in
Figure 3.9.
Figure 3.9: Tunnel diode and filtering electronics
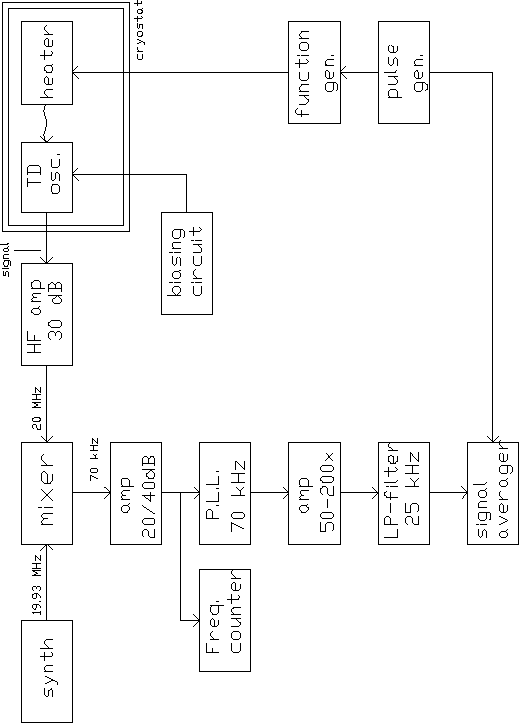
These filtering circuits separate the approx. 20 MHz RF signal from the
oscillator from the voltage needed to bias the tunnel diode. The RF signal
is first amplified with a 30 dB HF amplifier and then mixed down to
70 kHz with a synthesizer sine wave (Figure 3.10. Numbers
in this figure are meant as example).
This signal is then amplified with a
20 dB, 50-90 kHz amplifier. A frequency counter (HP 5300B) is used to keep
track of the TD resonant frequency. Next, the frequency
(corresponding to 4He film thickness) is ``translated''
into a voltage with a P.L.L. (Phase Locked Loop). This signal is amplified
50-200 times (with a Princeton 113 pre-amp) and filtered with a
25 kHz LP-filter to eliminate the 70 kHz (and harmonics) that come from
the P.L.L.
The resultant signal follows the 4He film thickness
change in the detector after a pulse is sent through the heater. This signal
is averaged up to 16384 times in a Nicolet 370 signal averager.
Figure 3.10: Detection system
3.7 Gas handling system
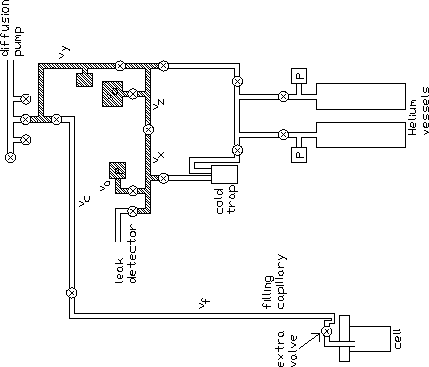
The gas handling system after addition of an extra valve
right above the cel is given
in Figure 3.11.
The extra valve was not present during the experiments described in
Chapter 4.
v0 is a calibrated volume used to
determine the other volumes.
Vtot is the volume used to admit 4He gas to the cell.
Figure 3.11: Gas handling system. P is a pressure gauge,
va = 3.46 ç, vx = 4.69 ç, vz = 3.48 ç,
v0 = 31.32 ç, vy = 39.2 ç, vc = 32.6 ç,
vf = 37.0 ç, vcell = 112 ç.
Shaded volume: Vtot = va + vx + vz + v0 + vy = 81.95 ç
Chapter 4
Experimental results
The experiment started by evacuating the cell and cooling down to 1.21 K.
During the experiment, the temperature was held at a value of
(1.21 ±0.02) K.
After cooldown to 1.21 K, the resonator circuit on the
copper bar resonated at 24 MHz. The circuit on the glass bar resonated
at 39 MHz. Helium gas was admitted from a room temperature volume
Vtot = 81.95 ç (see Figure 3.11).
A certain amount of gas was let
into this volume and the pressure was measured.
Opening the valves to the cell caused the 4He in the room temperature
volume to be sucked into the cell. Closing the valves and repeating the
procedure enabled a progressively thicker 4He layer inside the cell.
Adding together the pressures of helium in this volume that were admitted
gives the accumulated pressure pin, a measure for the number of atoms
in the cell.
Using the ideal gas law
the number of moles 4He in the cell can be found:
with R the ideal gas constant and T the temperature.
For each layer thickness, a large number (up to 16384) excitation
pulses were given consecutively on both bars and the
resulting detector signals were averaged. Due to
interference between both detector circuits, it was not
possible to measure on both bars simultaneously.
The excitation energy per pulse calculated according to
Section 3.5 amounted to 0.11 mJ
on the glass bar and to 0.13 mJ on the copper bar.
4.1 Third sound signals
A typical third sound signal on glass (ninol)
is presented
in Figure 4.1. On the horizontal axis is the time
after sending the heater pulse. On the vertical axis is the signal
as captured by the Nicolet signal averager (Section 3.6).
This signal corresponds with the 4He layer thickness at the detector.
The first peak seen in the signal is an artifact which
originates from interference by the heater pulse.
This peak is not seen at time 0 because of
delaying effects of the detection electronics. The second peak is
the first third sound pulse arriving at the detector. This pulse
has travelled 1/4 of the bar circumference (Section 3.3).
Up to eight third sound peaks can be seen in the signal.
By measuring the mean time between two adjacent peaks the third
sound speed can be calculated, using the circumference of the
bar, L = pd = p·1.0 cm = 3.142 cm with
d the diameter of the bar.
The third sound speed on glass c3,gl was in this case
(13.2 ±0.8) m s-1.
This corresponds to a film thickness of 8.5 atomic layers (using
Equation 1.1 and Figure 1.1).
1 atomic layer or a.l. of 4He corresponds to 0.36 nm.
On the glass bar, third sound was seen when at least 6.2 mmol
4He was admitted, with a corresponding measured third sound speed
c3,gl = (23.4 ±0.9) m s-1 and a calculated film thickness
d = 5.6 a.l.
In Figure 4.2, the third sound signal on glass with
ninol 4He in the cell is presented.
The third sound speed c3,gl now equals (5.02 ±0.22) m s-1,
corresponding to a film thickness of
16.4 a.l. In the plot again first an
interference peak, then two clear third sound peaks. After the second peak
reflections are seen (e.g. the positive peak at 7.5 ms), making the
determination of further peaks problematical. These reflections are
probably caused at the detector, where the small gap
causes interaction between the 4He films on both electrodes.
This interaction can cause a partial reflection of the third sound
wave.
A typical third sound signal (at ninol) on copper is
presented in Figure 4.3. Here six third sound peaks can
be distinguished. Third sound speed c3,Cu is now
(4.47 ±0.5) m s-1.
Under the same conditions, the third sound speed on glass was
measured (see above) and was c3,gl = (5.02 ±0.22) m s-1.
The 4He film thickness on copper dCu was calculated from c3,gl using the method described in the next section
and amounted to dCu = 21 a.l.
On the copper bar, third sound was seen
when at least 28.8 mmol 4He was admitted, with a
corresponding third sound speed c3,Cu(6.7 ±0.4) m s-1.
The film thickness on copper, calculating using c3,gl, was
in that case dCu = 16.3 a.l.
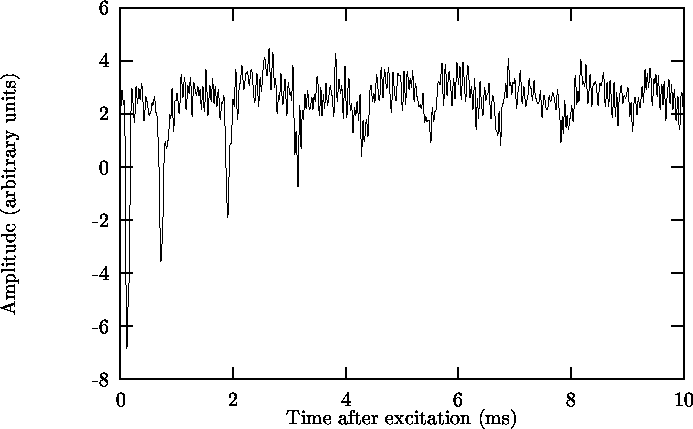
Figure 4.1: Third sound signal on glass. nin = 16.83 mmol.
Calculated c3 = (13.2 ±0.8) m s-1. dgl = 8.5 a.l.
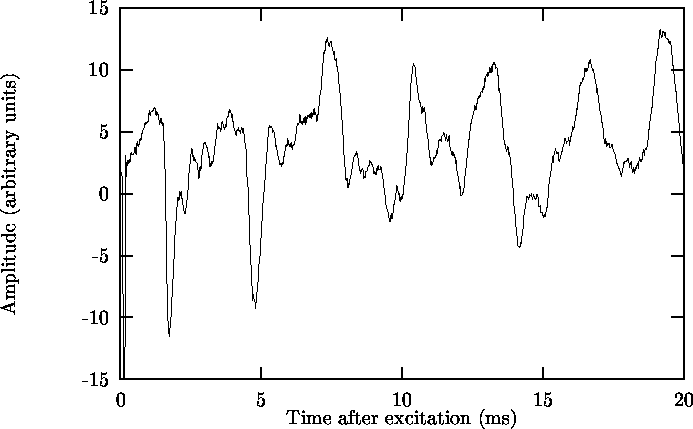
Figure 4.2: Third sound signal on glass. nin = 35.9 mmol.
Calculated c3 = (5.02 ±0.22) m s-1. dgl = 16.4 a.l.

Figure 4.3: Third sound signal on copper. nin = 35.9 mmol.
Calculated c3 = (4.47 ±0.5) m s-1.
dCu = 21 a.l.
4.2 Third sound speed
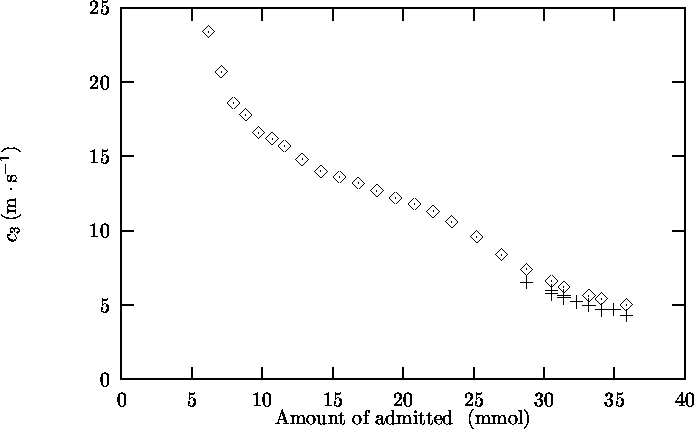
In Figure 4.4, the measured values of the third sound speed, both on copper and
on glass, are plotted against the amount of 4He admitted to the
cell, nin. Measurements on copper and on glass at the same value
of nin were performed consecutively (within 1 to 12 hours).
Picture Not Created.
Figure 4.4: Third sound speed c3 on copper and on glass as a function
of the amount of 4He in the cell, nin. à Glass; + Copper
4.2.1 Comparison of c3,gl and c3,Cu
In Figure 4.4 the third sound speed on glass c3,gl and the third
sound speed on copper c3,Cu at the same value of nin are very close
to each other.
This can be explained as follows.
Both bars are in the
same cell, which means that the vapour pressure pv is the same
above both substrates. Using Equation 1.8 it follows
that the Van der Waals potential at the film-vapour interface
W(d) has the same value for the 4He films on the copper
and glass bars. The definition of W, Equation 1.4
can be approximated by
and
(using d << b » 42 a.l.).
Since Wgl = WCu,
dCu can be expressed in dgl:
Using Equations 1.1 and 1.3 and
the approximated expressions for W (Equations 4.1
and 4.2) the ratio of the third sound speed on
copper and on glass in the same cell can be calculated as follows:
|
| |
|
|
|
|
|
|
æ
ç
è
|
|
rs
r
|
ö
÷
ø
|
f
|
fgl(dgl) dgl |
|
|
æ
ç
è
|
|
rs
r
|
ö
÷
ø
|
f
|
fCu(dCu) dCu |
|
= |
|
|
| |
|
| (4.4) |
| |
|
Thus c3,gl » c3,Cu.
4.2.2 Calculation of dgl and dCu
Measurement of c3,gl enables determination of the film thickness on glass
and on copper as described below (see also Table 4.1).
Using Equation 1.1 the 4He film thickness
on glass can be calculated from the third sound speed
since ggl is well know (2.6·10-24 m5s-2).
Now the Van der Waals potential W can be calculated using
Equation 1.4. Because this value is also the Van der Waals
potential on the copper bar, the film thickness on copper dCu can be calculated by inverting Equation 1.4.
The Van der Waals constant on copper, gCu, which is needed for this
calculation is taken from Brisson[3]
(gCu = 5.92 ·10-24 m5s-2).
Other sources for gCu are Pinkse[14]
(gCu = (2.8 ±1.4) ·10-24 m5s-2),
Shirron et.al.[16]
(gCu = (3.09 ±0.44) ·10-24 m5s-2),
and various theoretical predictions (5.5 to 6 ·10-24 m5s-2),
mentioned by Brisson.
| Equation 1.1: | c3,gl, ggl | ® | dgl |
| Equation 1.4: | dgl, ggl | ® | Wgl |
| Wgl | = | WCu |
| Equation 1.4: | WCu, gCu | ® | dCu |
Table 4.1: Calculating dCu from c3,gl
4.2.3 c3,Cu versus dCu
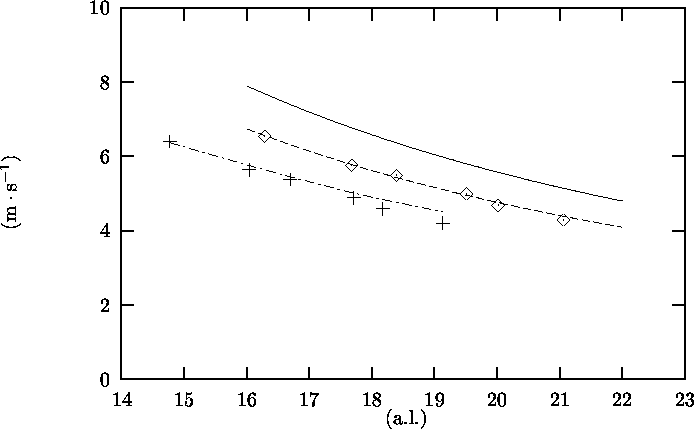
In Figure 4.5 the measured third sound speed on
copper c3,Cu is plotted against the film thickness on copper
as calculated from the third sound speed on glass
as described in Section 4.2.2 (diamonds).
The theoretical relation (Equation 1.1, now
for copper) is
given in the figure as well (solid line).
To calculate dCu from the measured c3,gl,
gCu = 5.92 ·10-24 m5s-2 (from Brisson[3])
and dead layer thickness D(T) = 1.91 a.l.
(from Equation 1.5) were used.
The theoretical values of c3,Cu lie 20% higher than the
measured values.
The dashes in Figure 4.5 give the
theoretical relation for c3,Cu as a function of dCu now using gCu = 4.3 ·10-24 m5s-2
and D(T) = 1.91 a.l.
This line seems to agree with the measured values
of c3,Cu. Note that here dCu is calculated from c3,gl using
gCu = 5.92 ·10-24 m5s-2 while
the theoretical values of c3,Cu are calculated from
dCu using gCu = 4.3 ·10-24 m5s-2.
It would be better to use the same value of gCu for both
calculations, but in that case it is not possible to get
a good fit. Better results are obtained if the dead layer
thickness D(T) (Section 1.2) is involved in the
fitting procedure as well.
The + marks in Figure 4.5 represent
c3,Cu as a function of dCu where
gCu = 4.3 ·10-24 m5s-2 and
D(T) = 5.66 a.l. are used.
The theoretical relation with these values for gCu and
D(T) is given as the dots&dashes. Now the
measured values for the third sound speed on copper
c3,Cu agree within a few % with the theoretical calculations.
Picture Not Created.
Figure 4.5: Third sound speed c3,Cu on copper as a function
of 4He film thickness dCu.
à and solid line: Experimental results and theoretical relation,
respectively, using gCu = 5.92 ·10-24 m5s-2 and D(T) = 1.91 a.l.;
Dashes: Theoretical relation with gCu = 4.3 ·10-24 m5s-2 and D(T) = 1.91 a.l.;
+ and dots&dashes: Experimental results and theoretical relation,
respectively, using gCu = 4.3 ·10-24 m5s-2
and D(T) = 5.66 a.l.
4.3 Third sound attenuation
4.3.1 Calculation of the attenuation coefficient a
To find the third sound attenuation coefficient a,
the amplitudes of the first and second third sound peaks
in a third sound signal (like Figure 4.1) are measured.
These two peaks represent two third sound waves that
were excited, ran some distance without passing the detector or heater,
and were detected.
They only differ in the distance the waves
ran over the substrate surface.
A1 is the amplitude of the first peak, where the third sound wave
travelled 1/4 of the bar circumference. A2 is the amplitude of the
second peak. Here the third sound wave travelled 3/4 of the bar
circumference.
Using the definition of a (Equation 1.6),
the ratio of these amplitudes can be used to calculate a:
|
|
A2
A1
|
= |
A(0) e- a([3/4] pd)
A(0) e- a([1/4] pd)
|
= e- [1/2] apd |
|
Here d is the bar diameter. Now the attenuation
coefficient can be calculated if A2 and A1 are measured
and d is known:
4.3.2 Attenuation on the glass bar
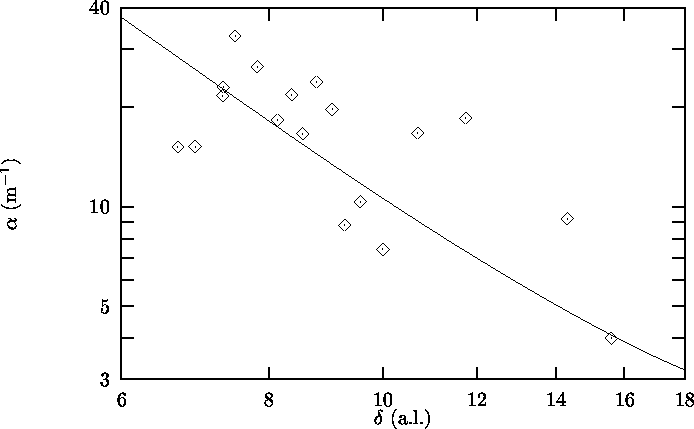
In Figure 4.6 values of the attenuation coefficient
a for third sound on the glass bar
measured in various experiments are
plotted as a function of 4He film thickness dgl
calculated using c3,gl (Equation 1.1).
The theoretical values as a function of d
as calculated
according to Brouwer[4,5]
in Section 1.3 for T = 1.21 K
are plotted in the same graph.
The data points show a large spread, but agree
in order of magnitude with the theoretical predictions.
Picture Not Created.
Figure 4.6: Third sound attenuation a on glass as a function
of 4He film thickness d. à Experimental results;
Solid line: Theoretical relation according to
Brouwer[4,5]
4.3.3 Attenuation on the copper bar
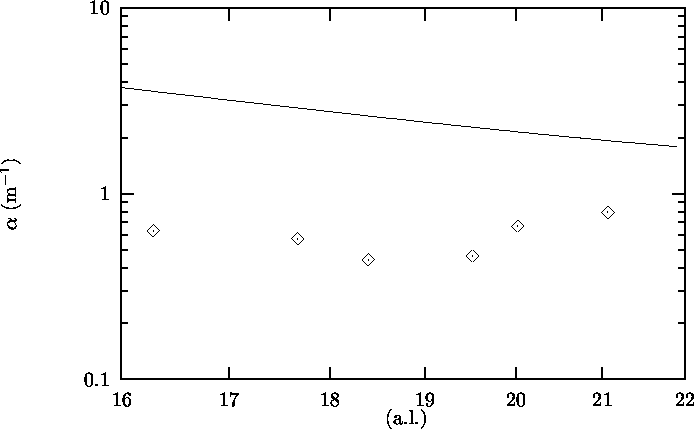
In Figure 4.7 the attenuation coefficient a
for third sound on the copper bar
is plotted as a function of 4He film thickness on copper dCu
calculated using c3,gl according to Section 4.2.2.
The theoretical predictions (according to Brouwer, Section 1.3) are also plotted in
the same graph.
Note the small spread in the data points
compared to the results on the glass bar.
Also note that the measured
attenuation is lower than the theoretical value.
Picture Not Created.
Figure 4.7: Third sound attenuation a on copper as a function
of 4He film thickness dCu. à Experimental results;
Solid line: Theoretical relation according to
Brouwer[4,5]
4.4 Discussion and conclusions
4.4.1 Third sound on copper
In the experiments described here, third sound was seen on a copper
substrate, although only on films thicker than » 16 a.l.
Pinkse[14] also measured third sound on copper on films
thicker than » 12 a.l. only.
A possible indication why third sound was not seen on thinner
films may be given from the value of the dead layer
thickness D(T) needed for the fitting of
the theoretical relation for c3,Cu(dCu) in Section 4.2.
A value of D(T) = 5.66 a.l. was found, while the relation
for D(T) in Section 1.2
gives a value D(T) = 1.91 a.l. for T = 1.21 K.
This high value of D(T) may
explain why third sound could not be seen in thin 4He films.
Also, the high thermal conductivity of copper compared to glass
may make the excitation of third sound on copper more difficult,
because more heat will flow away to the substrate and less heat will
be used to excite a third sound wave.
4.4.2 Comparison with Brisson's experiments
Brisson[3] could not see
third sound on a copper substrate.
An explanation for his failure may be derived from
the geometry of Brisson's heater (Figure 4.8),
which was different from
the geometry of the heater of the Leiden group (Figure 3.7).
In Brisson's case heat can flow from the
heater (at relatively high temperature) through the bulk Kapton and
Stycast into the copper substrate, while the heat flow from the heater
to the 4He film is limited by an extra Stycast layer on top of
the heater. Such an extra
layer is not present in the Leiden setup.
Figure 4.8: Brisson's heater
4.4.3 Attenuation coefficient on copper
The attenuation coefficient a on copper measured
for various values of film thickness dCu amounted to
(0.7 ±0.2 m-1)
(Figure 4.7).
Pinkse[14] also measured the attenuation coefficient
on copper and found values of the order of 70 m-1. Pinkse's values
are larger than the theoretical values[4,5],
which he attributes
mainly to the state of his copper bar: his copper surface is
``not polished and rather dirty''. The experiments described here,
with a polished copper bar, yield
an attenuation coefficient lower than the theoretical prediction.
Note that a higher value of a could be expected as a result
of impurity of the copper surface, but a lower value could not.
We have no explanation for this discrepancy.
Using the values gCu = 4.3 ·10-24 m5s-2 and
D(T) = 5.66 a.l. obtained in
Section 4.2 does not
bring down the theoretical attenuation coefficient
to the measured values.
The attenuation coefficient on the glass bar agrees with the
theoretical predictions.
4.4.4 Problem: Pressure determination
In the beginning of the experiment, a lead of the pressure
gauge outside the cryostat broke because someone tripped over the wire.
Repairing it shifted the
capacitance by an unknown amount, making pressure determination
impossible. For proper calibration, the capacitance at zero pressure
and low temperature is needed. This value could not be determined
as it was not possible to pump all the helium
out of the cell without warming up. When cycling from 4.2 K to higher temperature
and back there is a capacitance shift.
New cables were used for the leads of the pressure gauge,
because the old cables caused capacitance shifts as a result of
(unavoidable) vibrations. For both leads now a coaxial cable was used.
Also a different, more stable capacitance bridge was used to determine the
capacitance of the pressure gauge. The new bridge could measure capacitances
of 50 pF with a sensitivity of 0.0001 pF, corresponding with a pressure
of 0.007 mbar. The new bridge has not been used for the experiments described
in this chapter.
4.4.5 Problem: Film thickness determination error
For the thickest films, the film thickness d was
calculated both from the amount of 4He admitted to the cell,
nin, and from the third sound speed on glass, c3,gl.
The film thickness could not be determined from the vapour pressure
in the cell because of the problems with the pressure gauge described
above.
The first method used Equation 1.16.
Using the values of nin and c3,gl for the
thinnest film measured, nin = 6.20 mmol
gives a film thickness d = 35.1 a.l. while
c3,gl = (23.4 ±0.9) m s-1 gives d = 5.6 a.l. For
the thickest film measured,
nin = 35.9 mmol gives d = 250 a.l.
while c3,gl = (5.02 ±0.22) m s-1 gives
d = 16.4 a.l. Note that deteriotation of the
copper sinter or capillary condensation of 4He in the
sinter can not be held responsible for the high values of
d calculated from nin, because a smaller sinter surface
would give an even higher film thickness (the same amount of 4He would
spread out over a smaller surface).
A possible explanation for the discrepancy in the value for
the 4He film thickness calculated from the amount of 4He admitted to the cell and from the third sound speed on glass
may be that most of the helium that was let into the
cryostat may end up in the filling capillary in stead of in the cell,
because of counterflow effects in the capillary. The inside of the
filling capillary is covered by a superfluid helium film from the cell
up to the helium level in the bath. Above the helium level the capillary
gets warmer, reaching room temperature at the top flange. Around
the superfluid transition (2.17 K) the helium film will get very thick,
while the vapour pressure reaches 50 mbar. A superflow up in the film
combined by a flow of gas down may trap a lot of helium.
To be able to work around this problem, a low-temperature valve was
fitted just above the
cell. Using this valve the filling capillary can now be closed.
By admitting helium to the cell at temperatures larger than 2.17 K
and closing the valve during cooldown it was hoped to solve
the problem. New experiments may show if this extra valve indeed
solves the problem.
This appendix contains the drawings A.1 to A.6
that were made, mostly for the parts of the cell.
Figure A.1: Bottom plate in experimental cell
Figure A.2: Left frame piece
Figure A.3: Right frame piece
Figure A.4: Copper resonator bar
Figure A.5: Glass resonator bar
Figure A.6: Mounting platform
| Symbol | Unit | |
| A | m2 | Area for heat flux (A = Lx ·Ly) |
| A(x) | m | Third sound amplitude as a function of distance |
| a.l. | m | Atomic layer or 0.36 nm |
| c | m s-1 | Sound speed |
| c3,gl | m s-1 | Third sound speed on glass |
| c3,Cu | m s-1 | Third sound speed on copper |
| d | m | Bar diameter |
| D(T) | m | Dead layer thickness |
| E | J | Energy |
| fBE(x) | | Bose-Einstein distribution function, fBE(x) = [1/(ex - 1)] |
| f(d) | m s-2 | Van der Waals attractive force |
| g(w) | s | Density of states over w |
| g([k\vec]) | m3 | Density of states over [k\vec] |
| gW(q) | | Density of states (with w < W) over q |
| (h/2p) | Js | Dirac's constant |
| [k\vec] = (kx,ky,kz) | m-1 | Wave vector |
| kB | JK-1 | Boltzmann's constant |
| Lx,Ly,Lz | m | Crystal dimensions |
| m | kg | mass of a 4He atom |
| N = Nx ·Ny ·Nz | | Number of atoms in the crystal |
| Nw[k\vec] < w | | Number of [k\vec]-values with w[k\vec] < w |
| Nfilm | | Number of atoms in the 4He film |
| Nvapour | | Number of atoms in the 4He vapour |
| N0 | | Number of ``extra'' 4He atoms in the first one or two layers |
| n | m-3 | 4He number density; n = ( 1 a.l. )-3 |
| nin | mol | Number of 4He atoms in the cell |
| Symbol | Unit | |
| pv | Pa | Vapour pressure |
| psv | Pa | Saturated vapour pressure |
| [Q\dot] | W | Heat flux through a surface |
| R | Jmol-1K-1 | Ideal gas constant, R = 8.31411 Jmol-1K-1 |
| R | KW-1 | Thermal resistance |
| RK | K4m2W-1 | Kapitza resistivity |
| S | m2 | Surface area |
| T | K | Temperature |
| V | m3 | Volume (V = Lx ·Ly ·Lz) |
| Vtot | m3 | Room temperature volume for 4He admission |
| Z | | Set of integer numbers |
| | |
| a(q) | | fraction of phonons, coming in at an angle q,
that cross the interface |
| a | m-1 | Attenuation coefficient |
| b | a.l. | Retardation constant (b = 15 nm for glass) |
| g | m5s-2 | Van der Waals constant |
| ggl | m5s-2 | Van der Waals constant for glass (ggl = 2.6·10-24 m5s-2) |
| gCu | m5s-2 | Van der Waals constant for copper |
| d(x) | | Dirac delta function |
| d | m | 4He film thickness |
| dgl | m | 4He film thickness on glass |
| dCu | m | 4He film thickness on copper |
| q,f | | Angular coordinates of wave vector |
| l | m | Wavelength |
| ( [(rs)/(r)]) | | Superfluid fraction in bulk 4He |
| ( [(rs)/(r)])f | | Superfluid fraction in a 4He film |
| w | s-1 | Circular frequency |
| W | m2s-2 | Van der Waals potential |
| Wgl | m2s-2 | Van der Waals potential on glass |
| WCu | m2s-2 | Van der Waals potential on copper |
| w[k\vec] | s-1 | Circular frequency corresponding with wave vector [k\vec]
(w[k\vec] = c | [k\vec]| ) |
| ëx û | [x] | Largest integer smaller than or equal to x |
Bibliography
- [1]
-
H. van Beelen, syllabus ``Twee-fluïda Hydrodynamica'',
Leiden University, 1994
- [2]
-
J.P. van Best, Pascal software for Monte Carlo experiments on phonon densities,
http://qv3pluto.leidenuniv.nl/jvbest/phonon/,
Leiden University, 1996.
- [3]
-
J.G. Brisson II,
Third Sound Studies of Helium on Molecular Hydrogen,
Harvard University, Cambridge MA, U.S.A, 1990
- [4]
-
P.W. Brouwer, Derde Geluid - Theorie,
B.Sc. Thesis, Leiden University, 1992
- [5]
-
P.W. Brouwer, Pascal software for calculating third sound properties,
http://qv3pluto.leidenuniv.nl/jvbest/thirdsound/,
Leiden University, 1992.
- [6]
-
J. Richard Christman, Fundamentals of Solid State Physics,
Wiley, New York, 1988. p. 216
- [7]
-
W.A. Draisma,
Third sound in pure 4He and 3He-4He mixture films,
Ph.D. Thesis, Leiden University, 1993
- [8]
-
M.E.W. Eggenkamp, On 2D Heat Diffusion through a Glass Substrate
Coated by Helium ,
M.Sc. Thesis, Leiden University, 1992
- [9]
-
M.E.W. Eggenkamp, H. Khalil, J.P. Laheurte, J.C. Noiray, and J.P. Romagnan,
Heat diffusion through a glass substrate coated by a thin 4He film,
in Europhys. Lett. 21 (1993), 587-592
- [10]
-
W.E. Frick, D. Waldmann, and W. Eisenmenger,
Phonon Emission Spectra of Thin Metallic Films,
in Appl. Phys. 8 (1975), 163-171
- [11]
-
I.M. Khalatnikov,
An Introduction to the Theory of Superfluidity, 1965
- [12]
-
W.A. Little,
The Transport of Heat between Dissimilar Solids at Low Temperatures,
in Can. J. Phys. 37 (1959), 334-349
- [13]
-
J.C. Mester, E.S. Meyer, M.W. Reynolds, T.E. Huber, and I.F. Silvera,
Heat Transport via Evaporation of Superfluid Helium Films: Giant
Effective Kapitza Resistance, in Phys. Rev. Lett. 68 (1992),
3068-3071
- [14]
-
P. Pinkse,
New techniques in a third sound study,
M.Sc. Thesis, Leiden University, 1992
- [15]
-
P. Remeijer, Thermal and electromechanical excitation of
third sound in Helium films,
M.Sc. Thesis, Leiden University, 1990
- [16]
-
P. Shirron, K. Gillis, J. Mochel,
in J. Low Temp. Phys. 15 (1989),
p. 349
- [17]
-
W.J.McG. Tegart,
The Electrolytic and Chemical Polishing of Metals,
London, Pergamon Press, 1959
- [18]
-
J. Wilks and D.S. Betts,
And Introduction to Liquid Helium,
Oxford Science Publications, Oxford
File translated from TEX by TTH, version 2.53.
On 26 Oct 1999, 18:01.
Back to publications index


